Welcome to Predicer Control Center Documentation
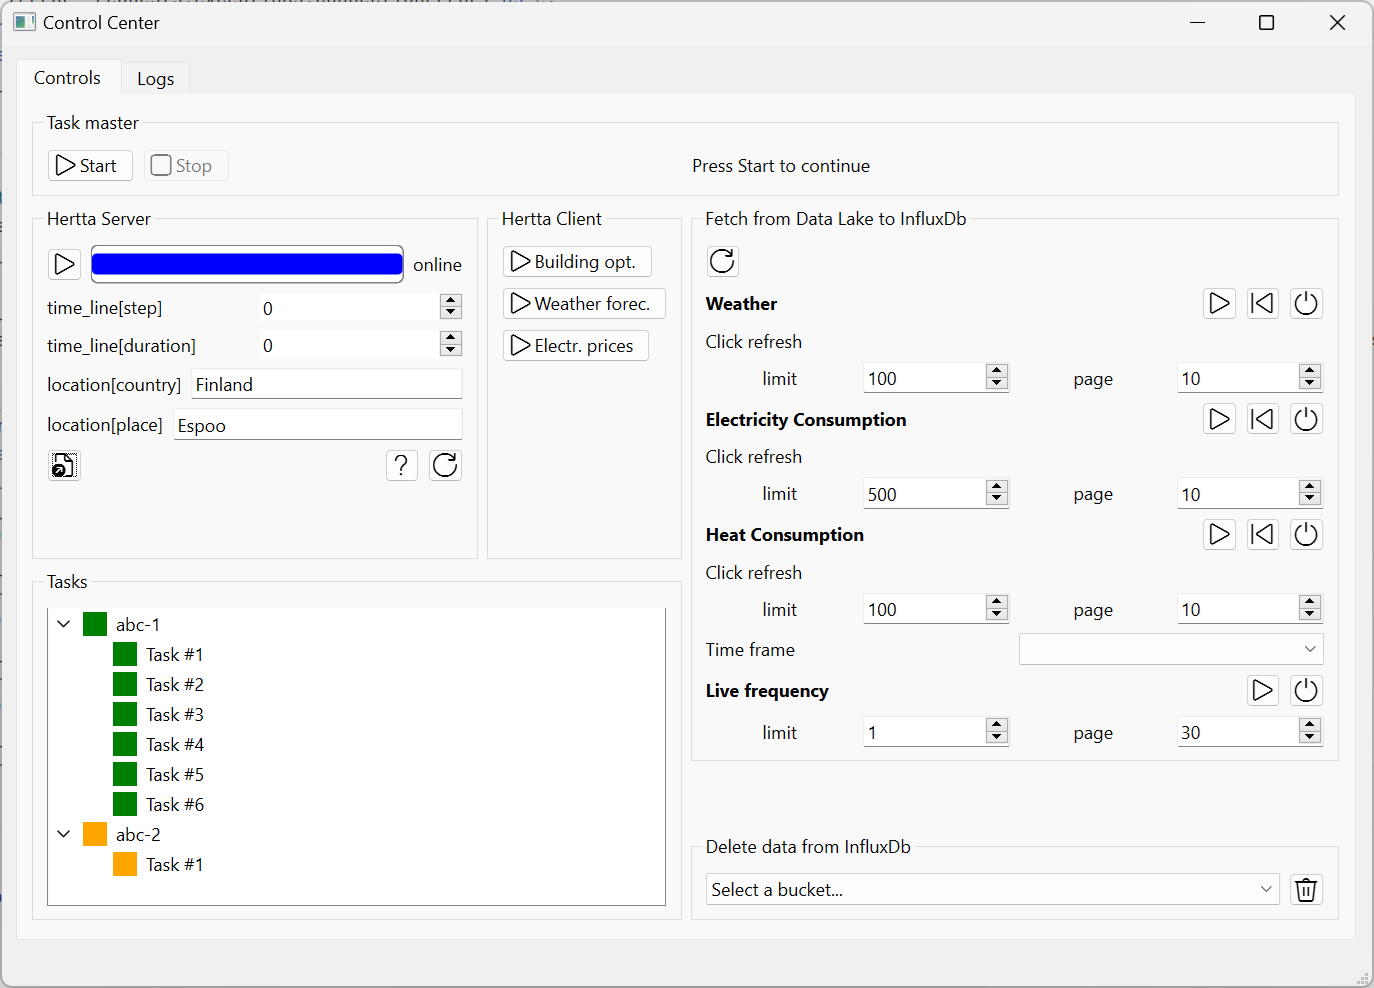
Control center is a cross-platform desktop application for running Predicer. It supports fetching input data from Center Denmark Dataportal, storing it into InfluxDB and displaying it in a Grafana dashboard. The input data can be fetched from other sources as well. Control center sends the input data to the Predicer model for processing and once it's finished, retrieves the output data and stores it into files or sends it to Grafana via InfluxDB for displaying.
1. Overview
Name: Predicer Control Center
Purpose: A desktop application for using Predicer.
Status: alpha
Repo(s): https://github.com/predicer-tools/control-center
Lead developer/Maintainer: Pekka Savolainen (Research Scientist, VTT)
Developers: Pekka Savolainen (VTT), Essi Nousiainen (VTT), Dennis Sundell (VTT), Antti Soininen (VTT), Esa Pursiheimo (VTT)
2. Architecture
- UI Layer
- PySide6
- Core Logic
- Python (business logic, data processing)
- Inter-process Communication (IPC)
- InfluxDB server/client architecture
- Grafana server/client architecture
- GraphQL
- Database
- InfluxDB
- Auth
- Credentials required for Center Denmark Data Portal and InfluxDB
- Packaging / Build
- PyInstaller
- Deployment:
- Distributed as a Windows installer (.msi or .exe with NSIS)
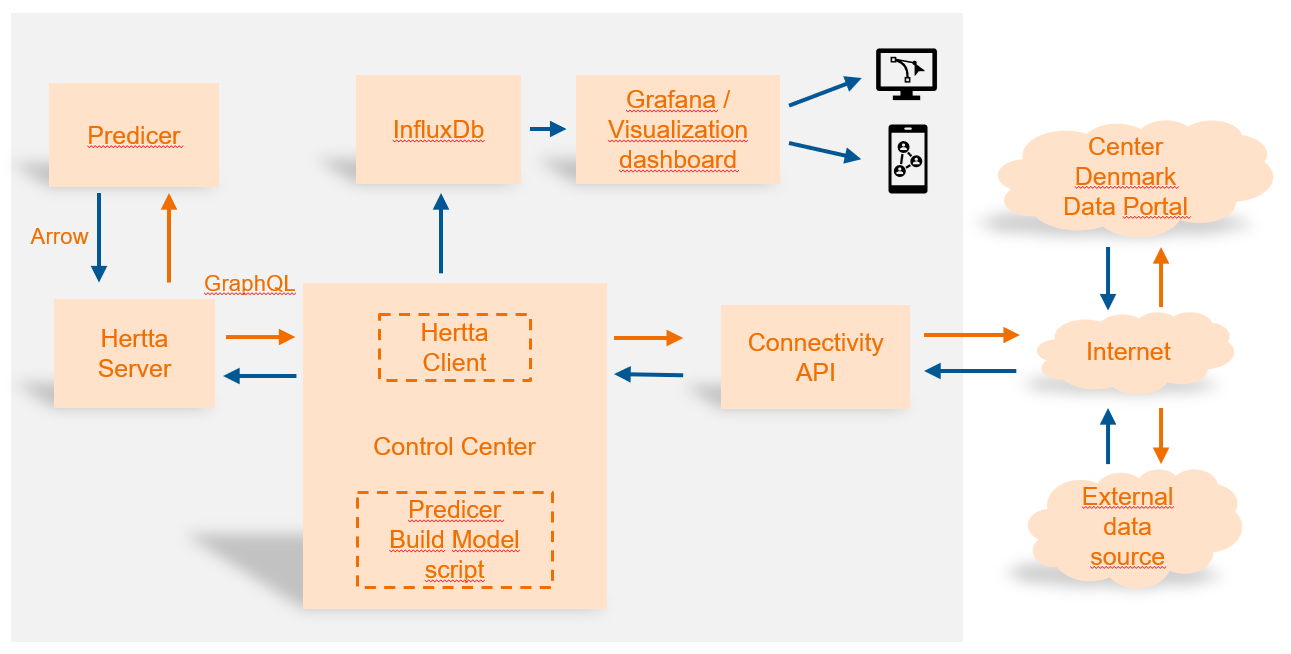
The picture below depicts the main software components related to the Control Center Graphical User Interface and how they interact with each other from a data flow perspective.
3. Installation instructions
See installation instructions in the Control Center repository (https://github.com/predicer-tools/control-center).
4. Core Features
Feature A: Retrieving input data from data portal and other sources
Feature B: Storing data to InfluxDB
Feature C: Viewing data using Grafana
Feature D: Communicating input/output data with Predicer using GraphQL
Feature E: Exploiting Predicer output data
Feature A: Retrieving input data from data portal and other sources
Retrieving input data from data portal requires that you have an active account in Center Denmark Dataportal. You also need to create a personal token on the site, when logged in. The Control Center won't be able to retrieve data from the portal without a token. See further instructions on how to pass tokens for the Control Center in the installation instructions. The Control Center needs to know the name of the dataset and other settings, which determine, what data is read from the data portal, from what time period, and the amount of data. When the data arrives to the Control Center, it is written into InfluxDB. For this, the user needs to have an installation of InfluxDB, and a token for access. Consult the installation instructions to get this part working.
Feature B: Storing data to InfluxDB
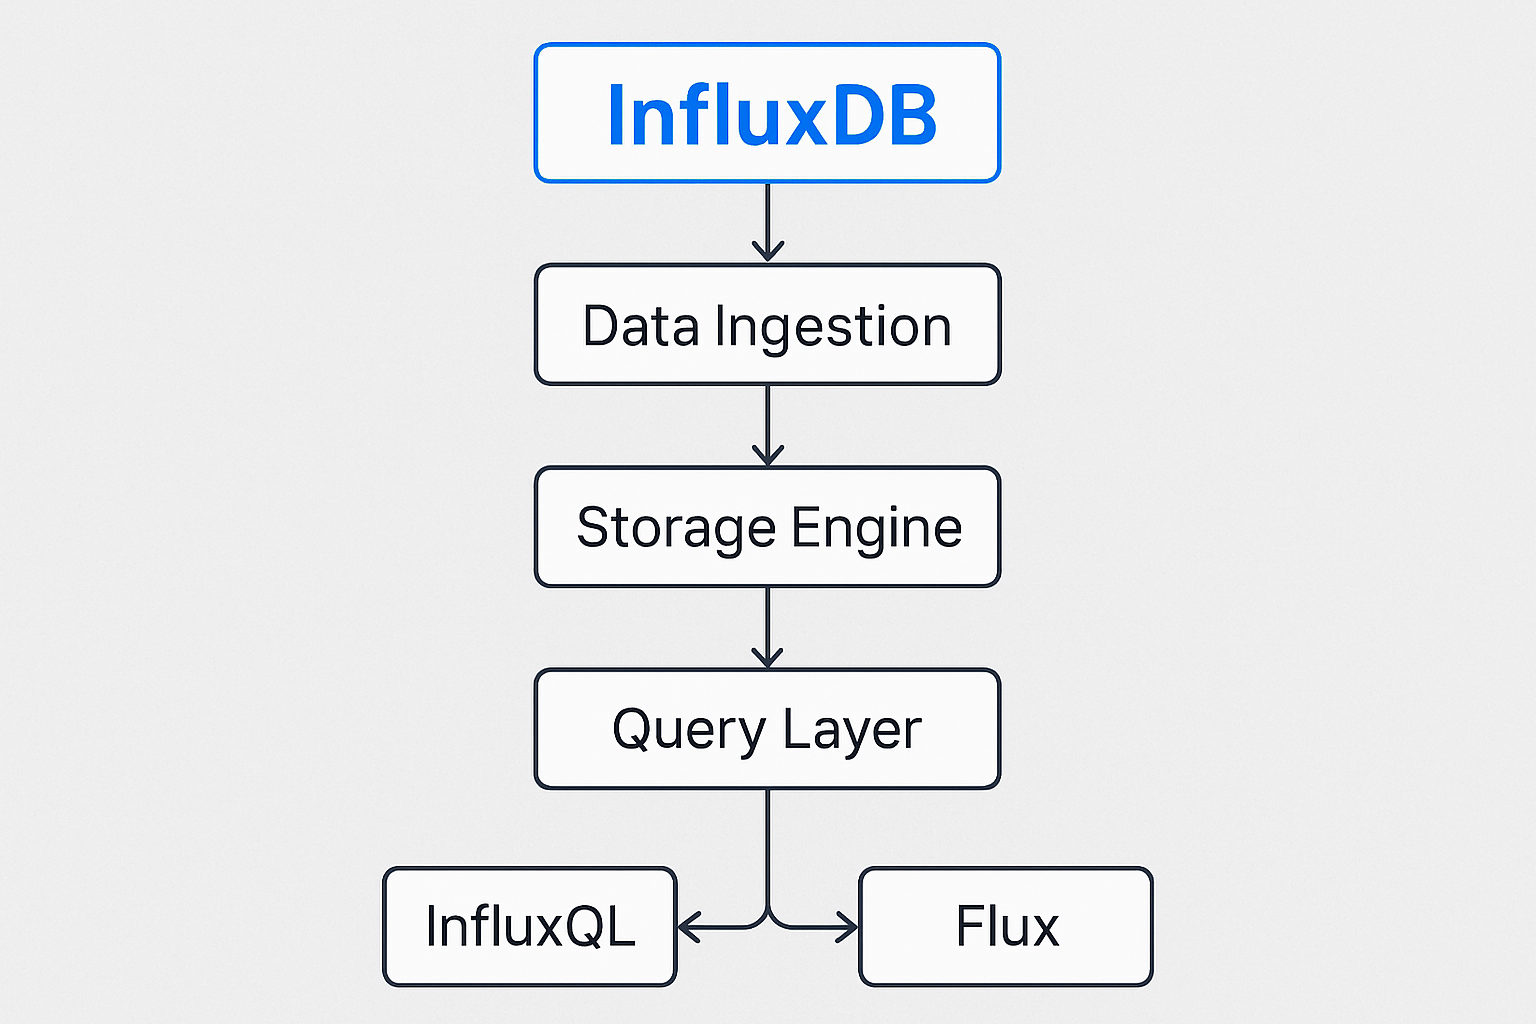
InfluxDB is a high-performance time-series database designed to store and query large volumes of timestamped data efficiently. It organizes data into measurements, tags, fields, and timestamps, enabling fast retrieval and aggregation of time-based metrics. InfluxDB uses a columnar storage engine optimized for time-series workloads and supports powerful query capabilities through InfluxQL or Flux. Common use cases include monitoring, IoT data collection, and real-time analytics, where high write throughput and low-latency queries are essential.
There are a lot of options for data ingestion to InfluxDB, such as telegraf, HTTP, gRPC, and line protocol, but the Control Center uses a Python InfluxDB client library to ingest data. As mentioned above, the downloaded data from Data Portal is stored into InfluxDB. InfluxDB can also be used to store the output data from Predicer.
Feature C: Viewing data using Grafana
Even though it is possible to build simple dashboards using InfluxDB's own features, we have elected to use Grafana instead. Grafana integrates with InfluxDB to provide powerful visualization and monitoring capabilities for time-series data. InfluxDB acts as the data source, storing metrics and events, while Grafana connects to it via a plugin or data source configuration. Grafana queries InfluxDB using InfluxQL or Flux, then transforms the results into interactive dashboards with charts, graphs, and alerts. This combination is widely used for observability, IoT analytics, and performance monitoring, enabling users to explore historical trends and real-time data in a highly customizable interface.
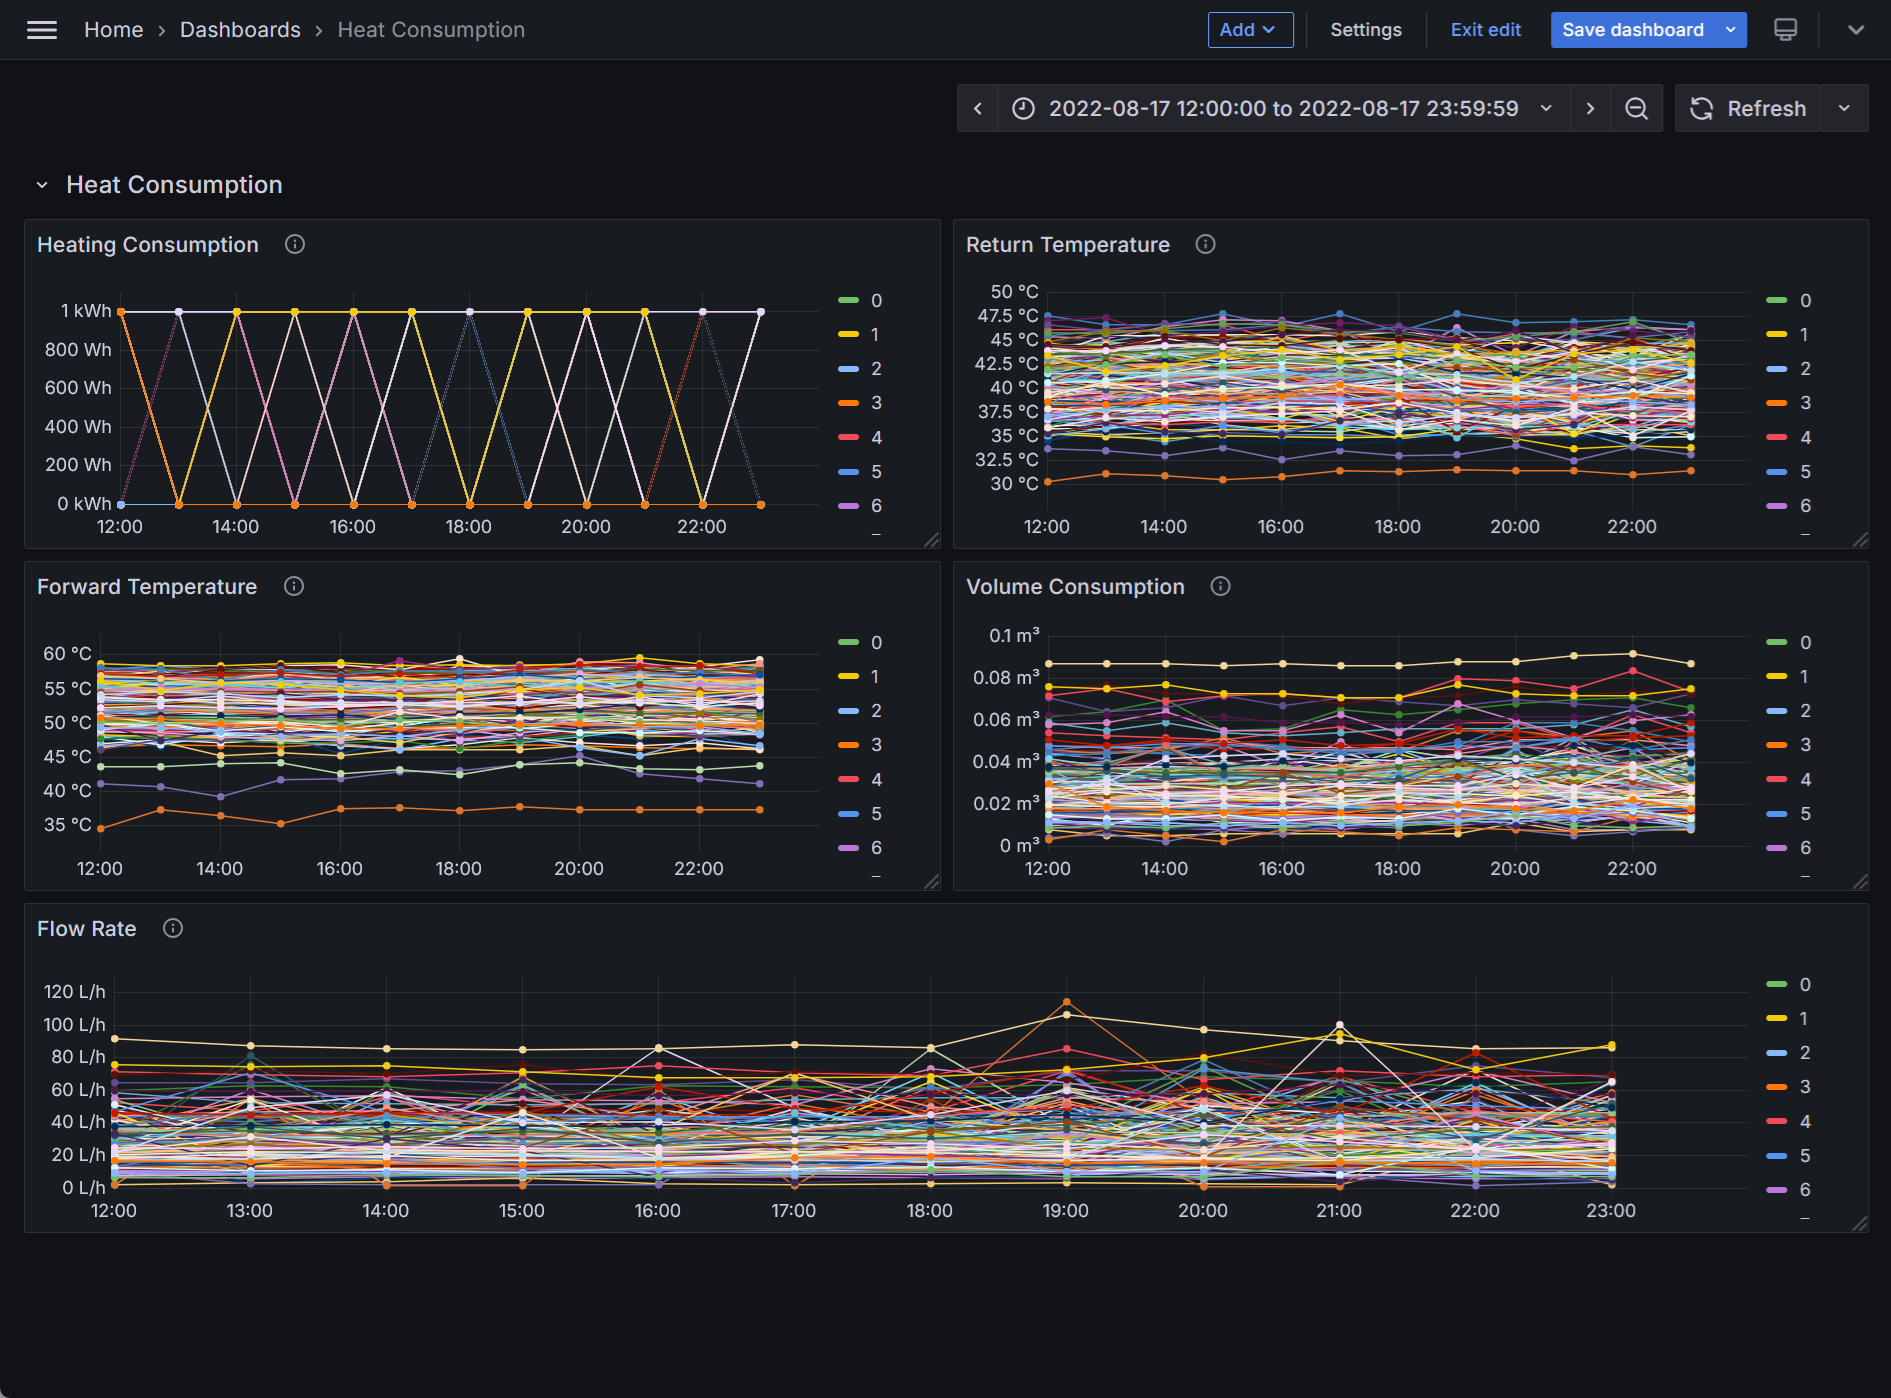
Below is an example of a Grafana dashboard with historical data downloaded from the Data Portal using Control Center. The implementation uses Flux as the query language.
Feature D: Communicating input/output data with Predicer using GraphQL
GraphQL serves as an efficient inter-process communication layer between the Control Center and the Julia-based Predicer by providing a flexible, schema-driven API for data exchange. The Control Center acts as a GraphQL client, sending structured queries and mutations to a GraphQL server exposed by Predicer. This approach enables precise data retrieval and updates without over-fetching or under-fetching, while supporting complex nested data structures. By leveraging GraphQL’s type system and resolvers, both processes can maintain clear contracts, improve interoperability, and simplify integration compared to traditional REST or RPC methods.
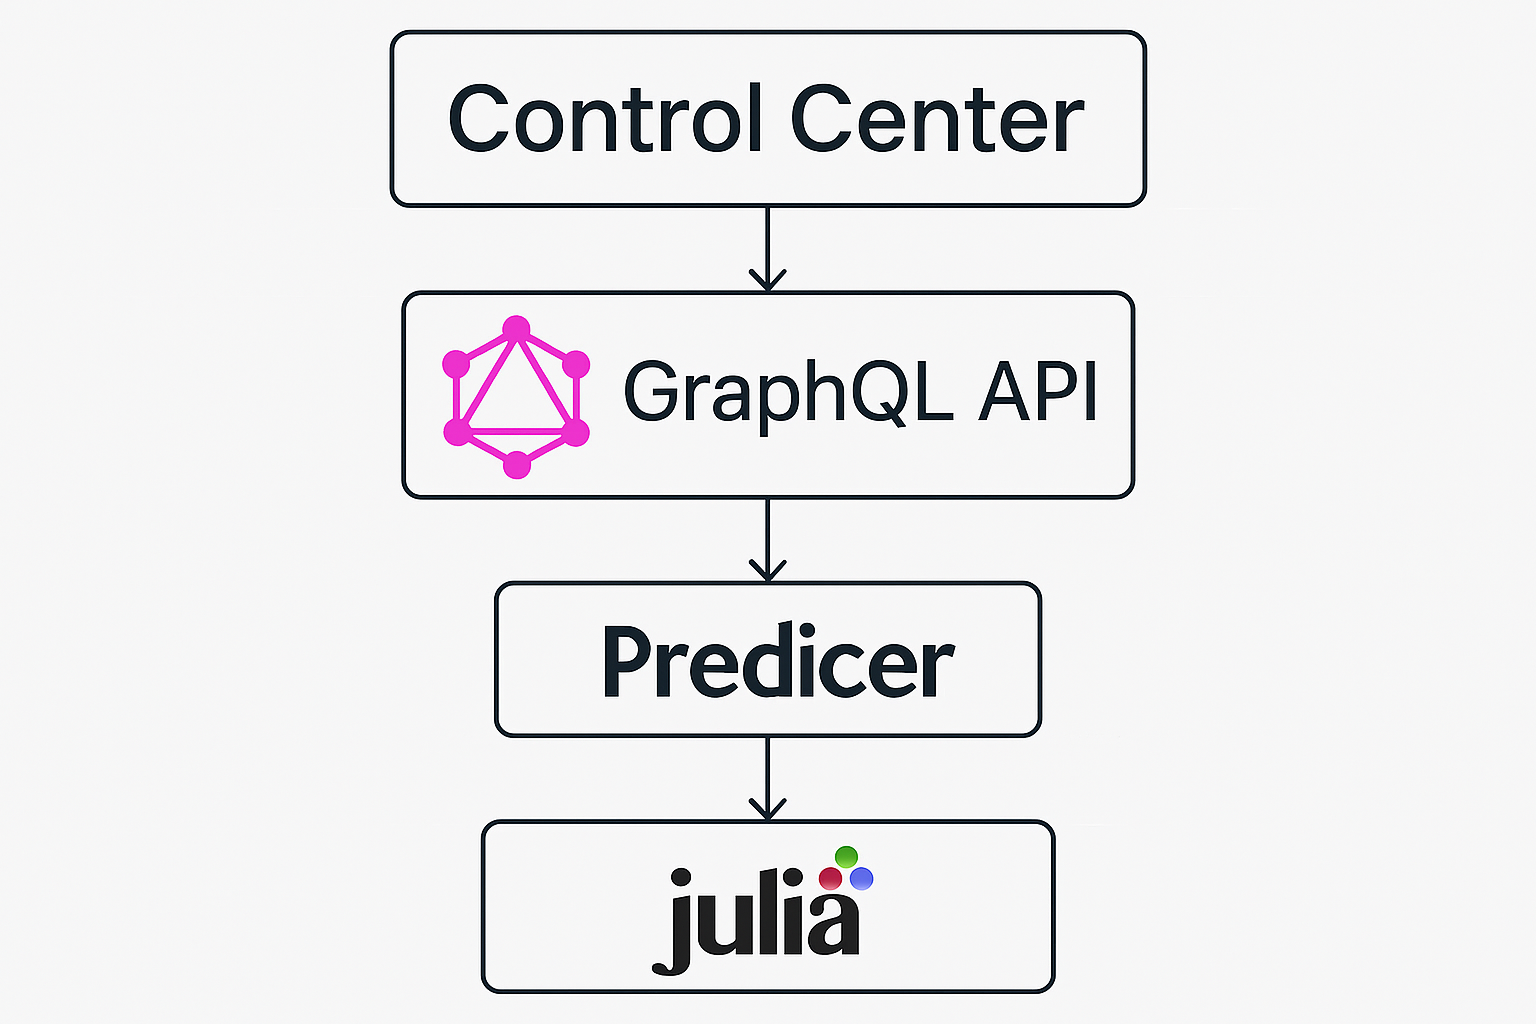
Using this approach, the Control Center is able to load a model into Predicer, send input data to the model, start the Predicer process, and once the Predicer process has finished, get the output data back from the Predicer to the Control Center.
Feature E: Exploiting Predicer output data
Once the Control Center receives output data from Predicer, there are several options that can be done with it. One option is to store the output data into a file for processing it in another program later. For example, some users may wish to have the output data in Excel format so that they can produce custom plots from the data or drop the data in a table for documentation purposes. Another option is that the output data is ingested into InfluxDB, and from there, displayed in a Grafana dashboard. A third option is to send the output data to the data portal. The first option will be implemented first, and if users require the other options, they can be easily added later.